David R. MacIver's Blog
Correlation does not imply correlation
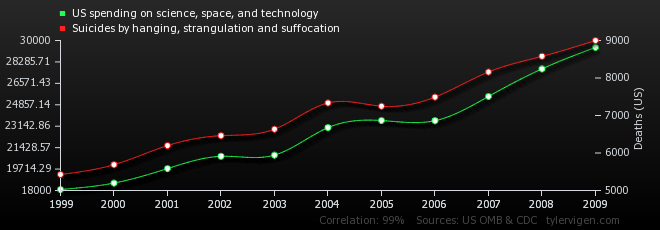
By now you’ve probably seen a graph like this:
(source)
The site tylervigen.com finds spurious and entertaining correlations. It’s pretty good. If you haven’t seen it I encourage you to go check it out.
Chances are if you’ve already seen it then you’ve seen it linked with some caption like “Reminder that correlation does not imply causation”.
I wish this wasn’t the take home message that people were deriving from this, primarily for two main reasons:
Firstly, I just don’t think this message needs pushing any harder. Most of the people who can usefully receive it either already understand stats well enough that they don’t need it or already understand stats badly enough that every time someone posts a paper they smugly assert “Ah, but correlation doesn’t imply causation” and then pat themselves on the back and say “Well done, me. You did a science. Good job. You deserve your cookie” (Sorry. This is one of the many peeves in my menagerie of pets). “Correlation doesn’t imply causation” has more or less reached saturation, and that saturation point is far larger than is actually useful.
But secondly, there’s something more interesting going on here.
Some of these correlations are very much of the classic common causal variable sort of correlation: Neither causes the other, but both are caused by the same thing. e.g. in the graph above, what we have is two variables which are increasing over time, so they correlate. This is unsurprising (if you’re wondering why they track so well on the graph that’s another interesting thing demonstrated here: Note that the two variables aren’t on the same scale. They only track that closely because the scale was adjusted to fit. This doesn’t actually affect the correlation, but it makes its display more convincing). More or them are like this:

(source)
Sure, the track is not quite as perfect as before, but it’s still remarkably good.
Clearly people are inspired by Miss America to commit hot steamy murder.
Except, well, that’s probably not what’s really going on. I mean, I’m not ruling out the possibility that there is some underlying common causal factor here, but it doesn’t seem very likely. What seems more likely is that this correlation has zero predictive power and actually it will fall apart if more data points are added. All that produced this graph is that the dice happened to roll the right way - the fact that for all 11 data points the graphs have tracked each-other is nothing more than a coincidence.
“But David,” you cry, “that seems incredibly unlikely. How could such a perfect relationship occur by chance?”
I’m glad you asked, suspiciously convenient anonymous blog commenter. I’m glad you asked.
The simple answer is that this happens in two ways. We only have 11 data points. This means that you can get quite high correlations purely by chance. The standard critical value for a correlation which will occur by chance no more than one time in 100 for this many data points is 0.684 . This is based on a model that doesn’t actually hold here, as it assumes normality of the data which is unlikely to hold for all these variables, but it illustrates the point. Also regardless of what your model is, a correlation of any sorts of variables that only holds by chance about one time in a hundred is probably a pretty reasonable correlation.
Still, one time in a hundred is a pretty big coincidence, right?
Well... it is if you’re not looking for it. The thing about things which happen one time in a hundred is that they’re surprising if you look at a single thing and it happens, but they’re not very surprising when you look at 100 things and one of them exhibits it.
And when looking at correlations there are a lot more than a hundred things you’re looking at, because you’re not just looking at the different variables you’re looking at pairs of them, and there are a lot more pairs than variables. So if there were e.g. 100 different variables then there would be 4950 pairs of variables (the formula is \(\frac{n(n-1)}{2}\) - there are n choices for the first variable, n - 1 choices for the other because it has to be a different one. This overcounts by a factor of two because the pairs are unordered so you can get each pair two ways depending on which you pick first, so divide the answer by 2).
This means that if you were looking for correlations that only occur one time in a hundred, you’d expect to find about 50 of them in 100 variables. And every time you double the number of variables, this goes up by a factor of (nearly) 4 - so if you had 200 variables you’d find 200 correlations, etc. In fact, the site seems to have about 3500 variables (based on some html scraping) so you’d expect it to find about 61,000 different significant correlations. Suddenly the fact that it was able to mine through all those variables to find things which track so well doesn’t seem very surprising, does it?
Which is the message I’d like people to derive from this site. Not that correlation doesn’t imply causation, but that there will always appear to be correlations if you look hard enough, even where none really exist, and you shouldn’t expect that the correlations you find that way will actually predict anything about future values. This is an object lesson about the dangers of running too many experiments and not considering that most of the positive results will be false positives, not about the conclusions you draw from those results.
Comments
Franklin Chen on 2014-05-13 17:48:58:
Also, the story of how some very famous statisticians used “correlation does not imply causation” to support the tobacco industry is, I think, a fascinating story that everyone should learn about, to understand the big picture of the messy world of applying statistics.
david on 2014-05-13 17:53:28:
That does sound interesting. I can sortof imagine how it would have gone, but do you have a link to details?
Nick on 2014-05-13 20:21:12:
The other thing that bothers me about that site is the use of linear correlation coefficients when it’s obvious that any correlation there is decidedly nonlinear.
How hard can it be? | David R. MacIver on 2014-05-16 11:27:43:
[…] “Data scientist” – Statistics: How hard can it be? […]